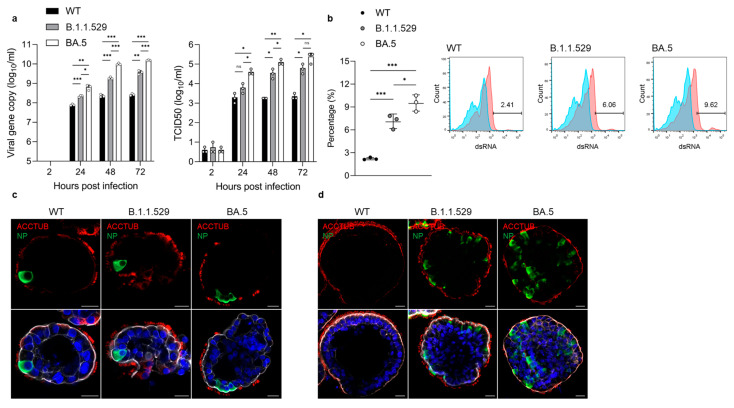
Figure 4.
SARS-CoV-2 variants infection in apical-out airway organoids. (a) At the indicated hours post-infection (hpi) with SARS-CoV-2 wildtype (WT), Omicron variants B.1.1.529 and BA.5 (1 MOI), culture media were harvested from the infected apical-out airway organoid (AwO) and applied to viral load detection (left) and viral titration (right). Data represent means ± SD of a representative experiment, n = 3. Multiple unpaired t-test with multiple comparisons using the Holm–Sidak method was carried out. * p ≤ 0.05, ** p ≤ 0.01, *** p ≤ 0.001. (b) At 24 hpi, SARS-CoV-2 WT-, B.1.1.529- and BA.5 (1 MOI)-infected apical-out airway organoids were harvested and assessed using flow cytometry to quantify dsRNA+-virus-infected cells. Data on the left represent means ± SD of a representative experiment, n = 3. Ordinary one-way ANOVA with Tukey’s multiple comparison test comparing every other group. Representative histograms are shown in the right: red, infected cells stained with target antibodies; blue, mock-infected cells stained with target antibodies. (c,d) Confocal images of ciliated cell marker ACCTUB (red) and SARS-CoV-2 nucleoprotein (NP, green) in infected apical-out airway organoids at (c) 24 hpi or (d) 72 hpi. Nuclei and actin filaments were counterstained with DAPI (blue) and Phalloidin-647 (white), respectively. Scale bar = 20 μm.

