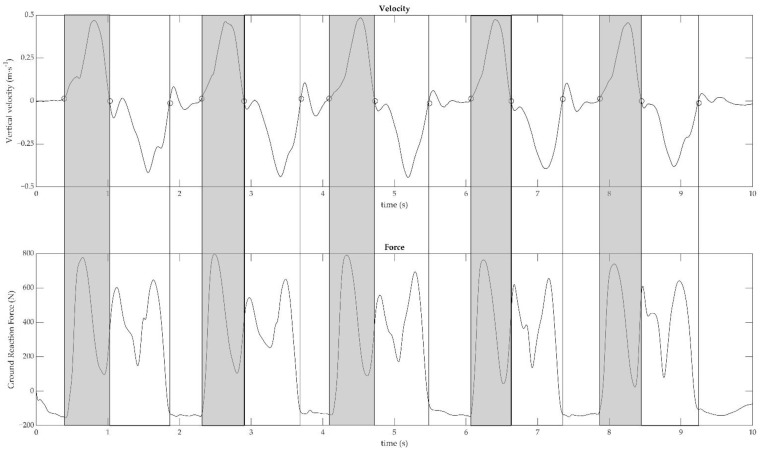
Figure 2.
Vertical velocity (m s−1; above) measured by motion capture and vertical force (N; below) measured by force plate in the 5 Sit to Stand test are plotted in function on time (s) in a representative participant. The points (○) mark the events of each repetition (start, standing position, and end). Light grey sections highlight the concentric phases (i.e., raising phase) while white sections highlight the eccentric phases (i.e., sitting phase).

