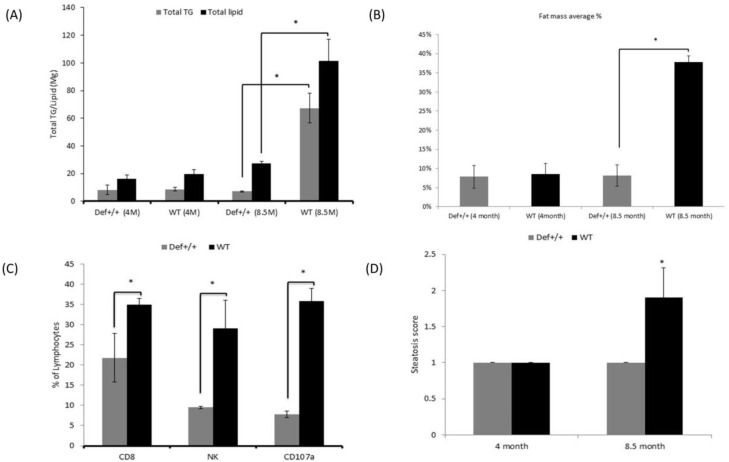
Figure 2.
(A) Average ratio of total lipid content and total triglycerides (TG) per liver in Def+/+ transgenic and WT mice at the ages of 4 and 8.5 months. Eight mice in each experimental group were assessed. Values of WT total lipid content and total TG are presented in the black and gray bars, respectively. (B) Percentage (%) of liver fat mass average based on EchoMRI analysis in the WT and Def+/+ transgenic mice at ages of 4 and 8.5 months. Eight mice were assessed in each experimental group. x-axis shows the experimental groups, and the y-axis shows the percentage (%) of liver fat mass with standard deviation presented on the bars. (C) Percentage presentation of the total lymphocytes of pro-fibrotic markers in the serum as an indicator of fibrosis in the liver in the WT and Def+/+ transgenic mice at 8.5 months of the experimental period. The three markers are CD8 cells, the anti-fibrotic NK lymphocytes, and the NK cell activation marker CD107a. Six mice in each experimental group were assessed. Values of WT and Def+/+ transgenic mice are presented in the black and gray bars, respectively. (D) Main steatosis grade in the WT and Def+/+ transgenic mice at the ages of 4 and 8.5 months. Six mice in each experimental group were assessed. Values of WT and Def+/+ transgenic mice are presented in the black and gray bars, respectively. x-axis shows the WT and Def+/+ transgenic mice and the y-axis shows the steatosis grade with standard deviation presented on the bars. Asterisk (*) indicates p < 0.05 between WT and Def+/+ transgenic mice.

