Figure 2.
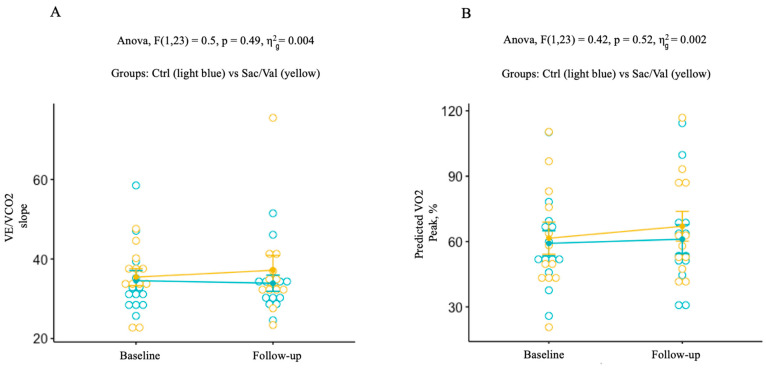
Figure 2. (A) Changes of VE/VCO2 slope, from baseline to follow-up, in the control group (blue) and in the Sac/Val group (yellow) (p 0.49). (B) Changes of predicted peak VO2 from baseline to follow-up in the control group (blue) and in the Sac/Val group (yellow) (p 0.53). VE/VCO2: minute ventilation to carbon dioxide production; VO2: oxygen consumption.

