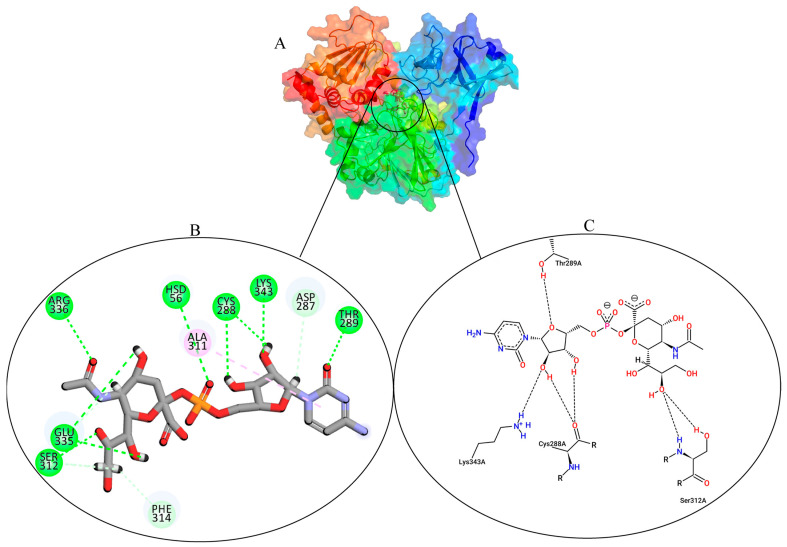
Figure 3.
Protein plus image showing the native ligand inside the active pocket (A). Discovery studio analysis showing the different interactions. The dashed green lines indicate hydrogen bonds, and the magenta indicates hydrophobic interactions (B). Two-dimensional (2D) images of the interactions by protein plus (C).

