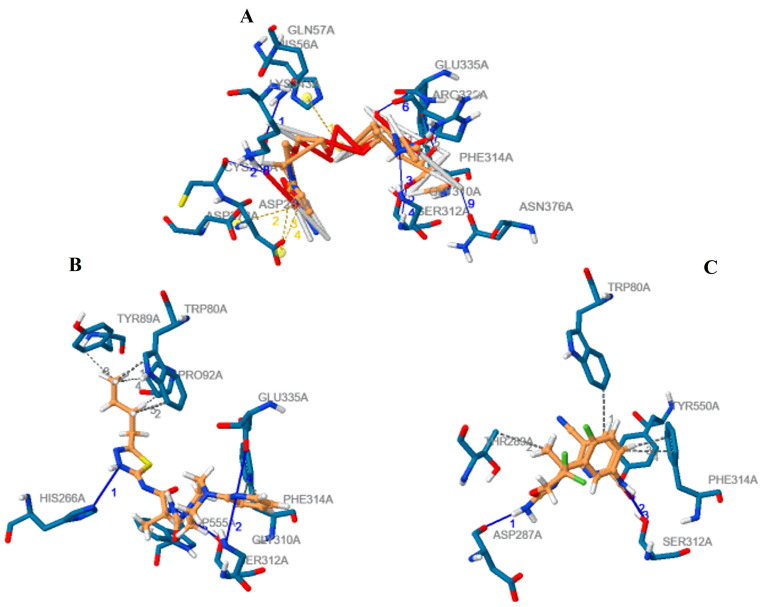
Figure 8.
The detailed comparative assessment by the PLIP tool of the different interactions of the CMAH complexes with the native ligand (A), inhibitor 1 (B) and inhibitor 2. (C) The hydrophobic interactions, hydrogen bonds, and salt bridges are represented by the grey dash line, blue line, and yellow dash line, respectively.

