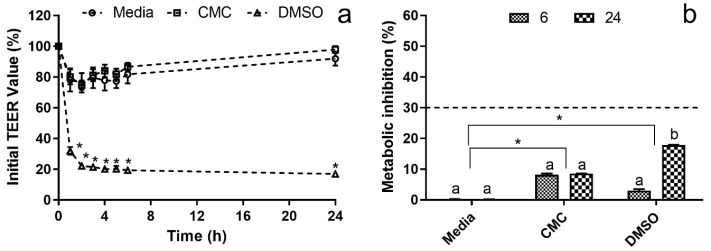
Figure 3.
Hep G2 systemic cytotoxicity co-culture model. (a) Co-culture model membrane stability in the percentage of the initial TEER value. * Represents the statistically significant differences (p < 0.05) found between conditions in each sampling point. (b) Cytotoxicity profile of the evaluated samples against Hep G2 in the basolateral side of the co-culture model. The dotted line represents the 30% cytotoxicity limit as defined by the ISO 10993-5:2009 standard (ISO, 2009). Different letters represent the statistically significant differences (p < 0.05) found for each condition between sampling times. * Represents the statistically significant differences (p < 0.05) found between the test conditions and the blank (media) control.

