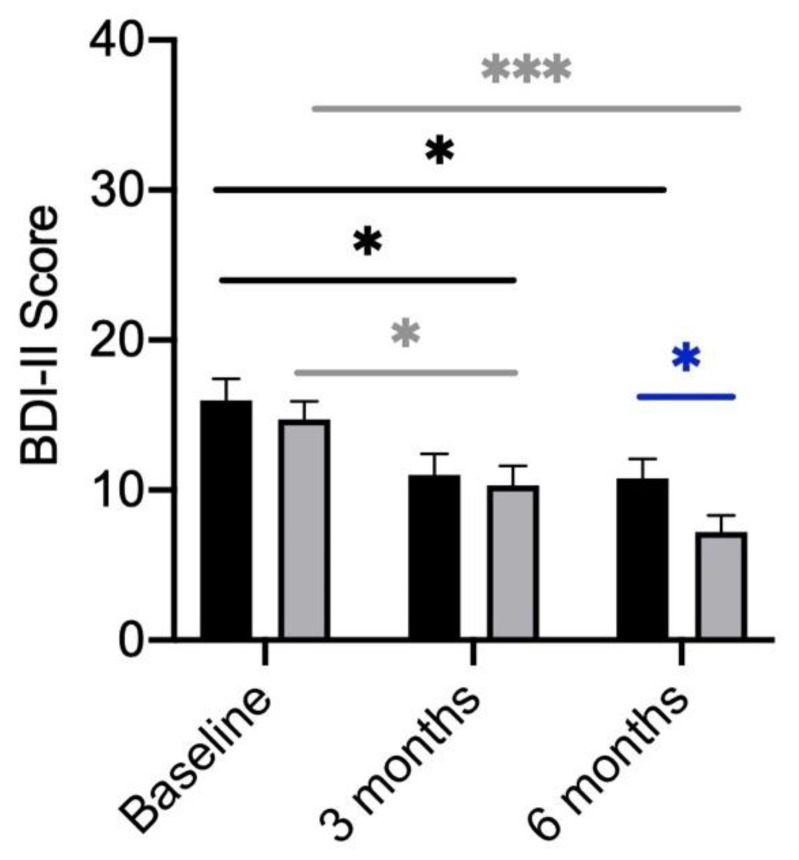
Figure 2.
BDI-II Scores of participants divided by treatment (verum; grey column) with placebo (black column). BDI-II scores compared between the verum and placebo arms over the course of treatment. Significant differences determined by Mann–Whitney U test. Grey * shows significant differences between patients of the verum group at different time points. Black * shows significant differences between patients of the placebo group at different time points. Blue * shows significant differences between placebo and verum.* p-value < 0.05; *** p-value < 0.001.

