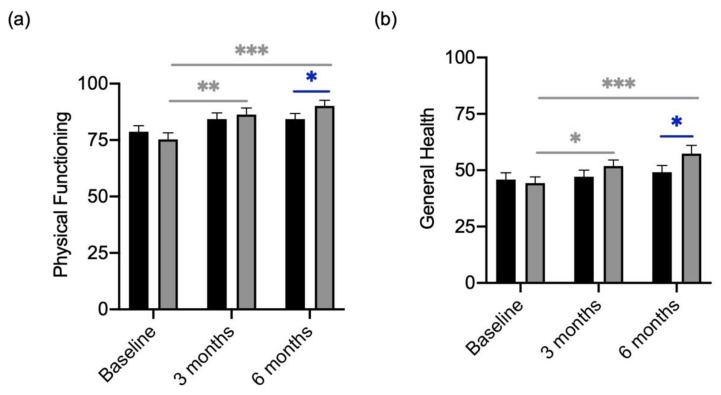
Figure 3.
Quality of Life Scores in “Physical functioning” and “General Health” of participants divided by treatment (verum; grey column) with placebo (black column). (a) Changes in “Physical functioning” scores over the course of treatment with placebo and verum. (b) Changes in “General Health” scores over the course of treatment with placebo and verum. Grey * shows significant differences between patients of the verum group at different time points. Blue * shows significant differences between placebo and verum. * p-value < 0.05; ** p-value < 0.01; *** p-value < 0.001.

