Figure 1.
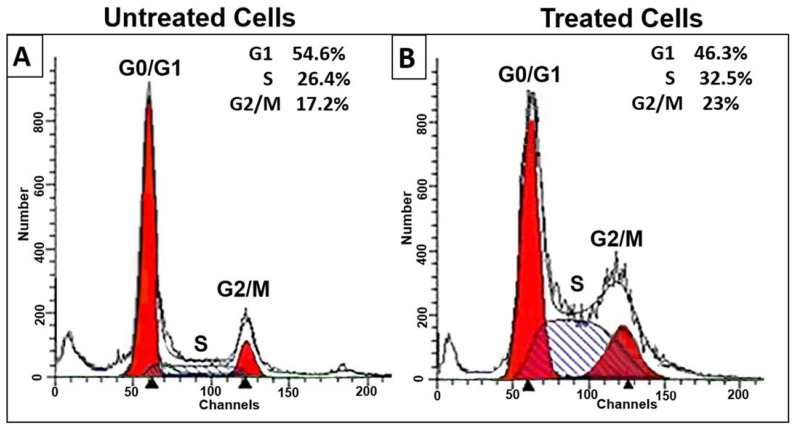
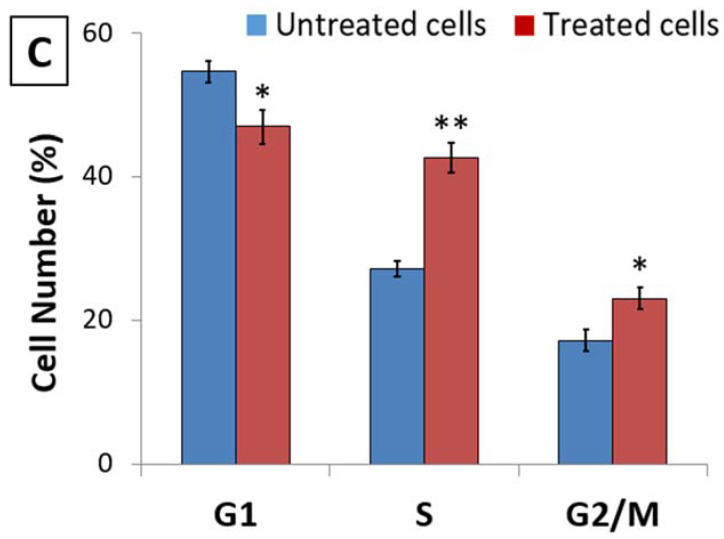
Effect of 48 h of D. zibethinus methanol extract treatment on HL-60 cells. The cell cycle distribution assessed by flow cytometry in (A) untreated and (B) D. zibethinus methanol extract treatment on HL-60 cells shows significant cell accumulation in the S phase and G2/M phase. (C) Bar graph showing the accumulation of HL-60 cells in each cell cycle phase after 48 h of D. zibethinus methanol extract treatment. Values are the mean ± S.E. of three individual experiments. * Values are statistically significant at p < 0.05 relative to the control. ** Values are statistically significant at p < 0.001 relative to the control.


