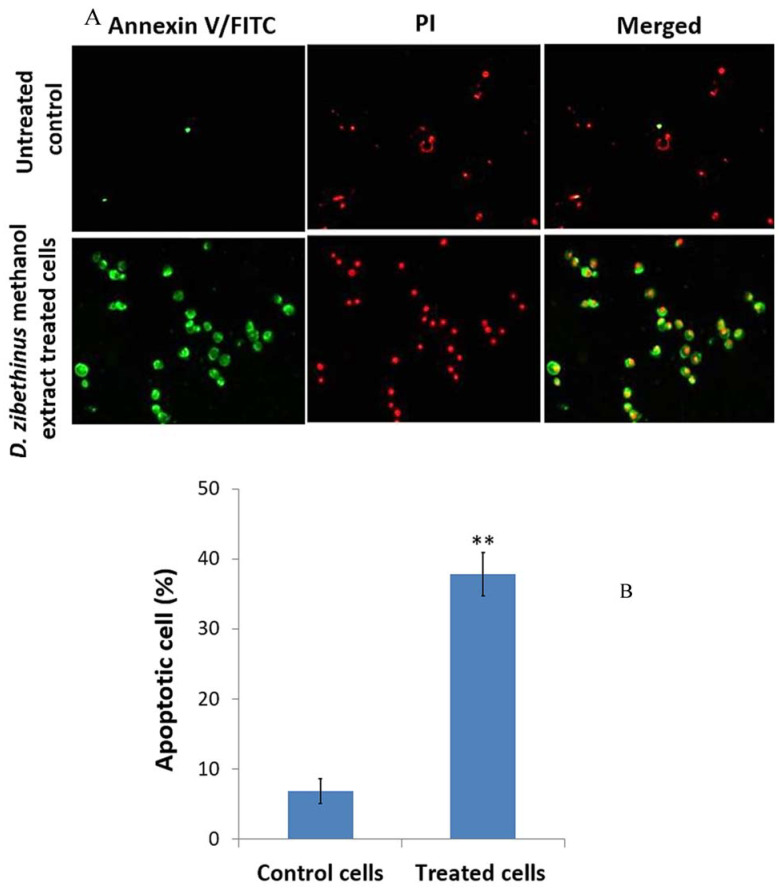
Figure 2.
Evaluation of apoptosis using Annexin-V FITC/ Propidium Iodide (PI) staining. (A) Images of the apoptotic cells (green color), necrotic cells (red color), and later stages of apoptotic phase (merged) of 48 h IC50 concentrations of D. zibethinus methanol extract-treated and untreated control HL-60 cells. (B) Statistical analysis of the staining results indicates a significant increase in the apoptosis rate of HL-60 cells treated with D. zibethinus methanol extract compared with the untreated control group. Values are the mean ± S.E. of three individual experiments. ** Values are statistically significant at p < 0.001 relative to the control.

