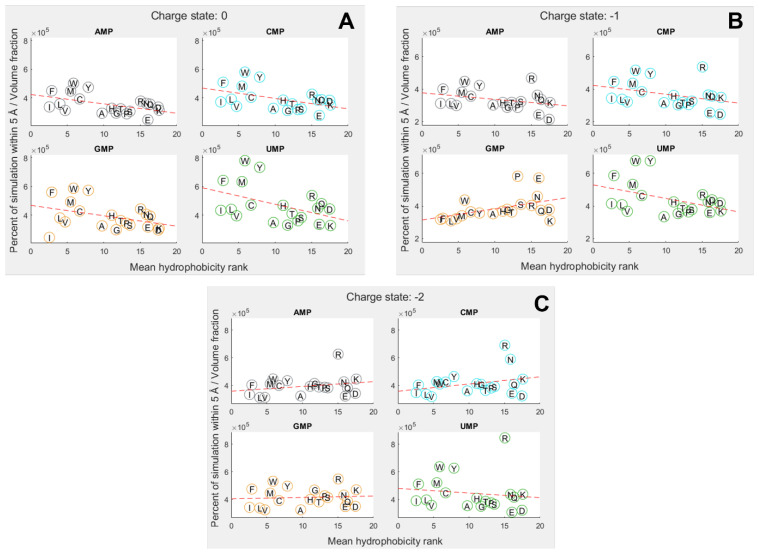
Figure 3.
Proportion of simulation time for each amino acid within 5 Å of a nucleotide, adjusted for molecular volume. Amino acids are denoted by their single letter codes and organised by mean hydrophobicity rank, calculated from Trinquier’s 43 scales [8,80]. (A) phosphate charge state = 0; (B) phosphate charge state = −1; (C) phosphate charge state = −2. Dotted red line shows best fit from a linear regression. Distance is measured relative to nucleobase rings.

