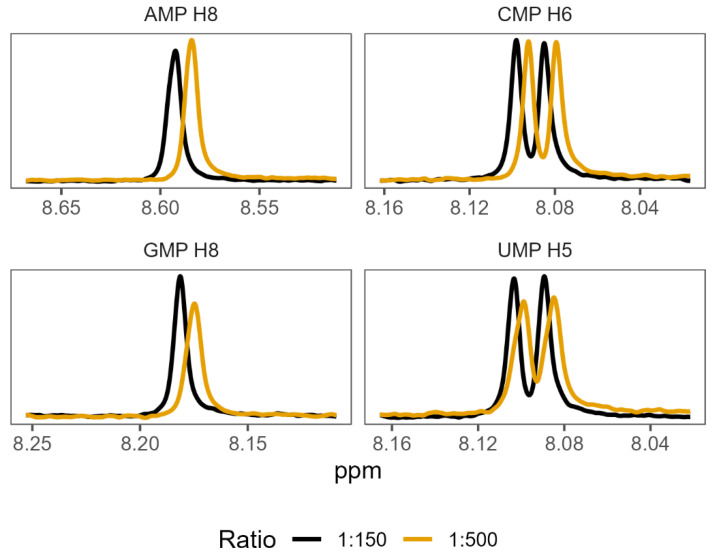
Figure 4.
1H NMR spectra showing characteristic changes in proton chemical shift perturbations (or changes) as the ratio of amino acid to nucleotide increases. The panels show mixtures of phenylalanine with each of the 4 mononucleotides, at 2 representative ratios: 1:150 nucleotide to amino acid, and 1:500 nucleotide to amino acid. Numbers next to each NMP refer to the proton probes used for measurement of peak shifts (see Supplementary Figure S1 for numbering).

