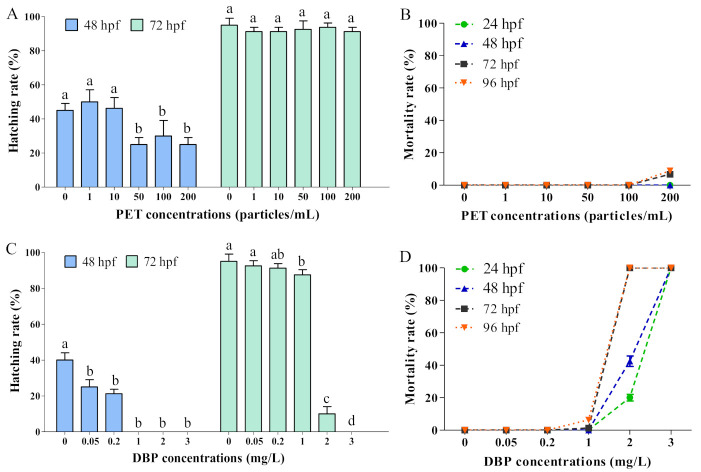
Figure 2.
Hatching and mortality rates of zebrafish embryos under PET and DBP expositions. (A) Hatching rate at 48 hpf and 72 hpf with PET exposition; (B) Mortality rate at 24 hpf, 48 hpf, 72 hpf, and 96 hpf with PET exposition; (C) Hatching rate at 48 hpf and 72 hpf with DBP exposition; (D) Mortality rate at 24 hpf, 48 hpf, 72 hpf, and 96 hpf with DBP exposition; values represent mean ± SD (n = 4); the letters above the bars indicate significant differences (p < 0.05). If two arbitrary groups have the same letter, then they are not significantly different.

