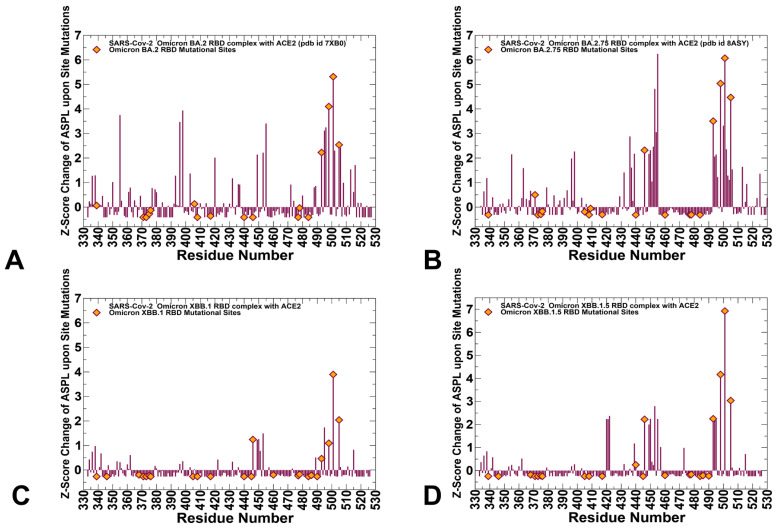
Figure 6.
Mutation-induced changes in the topological network parameters for the complexes of the SARS-CoV-2 S protein. The residue-based Z-score profile estimates the average mutation-induced changes in the ASPL parameter for the BA.2 RBD-ACE2 complex (A), BA.2.75 RBD-ACE2 (B), XBB.1 RBD-ACE2 (C) and XBB.1.5 RBD-ACE2 (D). The profiles are shown as maroon-colored bars. The positions of the Omicron mutational sites residues are shown in orange-filled diamonds.

