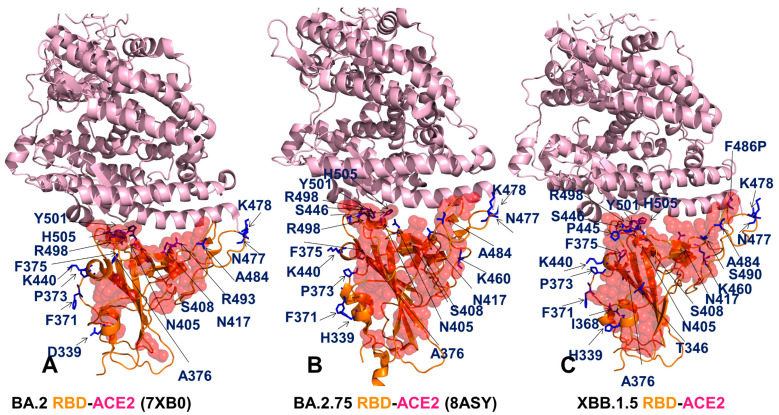
Figure 7.
Structural mapping of the intrinsic RBD communities for the Omicron RBD BA.2-ACE2 complex, pdb id 7XB0 (A), the Omicron RBD BA.2.75-ACE2 complex, pdb id 8ASY (B), and the Omicron RBD XBB.1.5-ACE2 complex (C). The RBD is shown in orange-colored ribbons. ACE2 is in light, pink-colored ribbons. The RBD communities are shown in red-colored spheres with a 50% reduced transparency. The Omicron BA.2, BA.2.75 and XBB.1.5 mutational sites are shown in blue-colored sticks, annotated and indicated by arrows.

