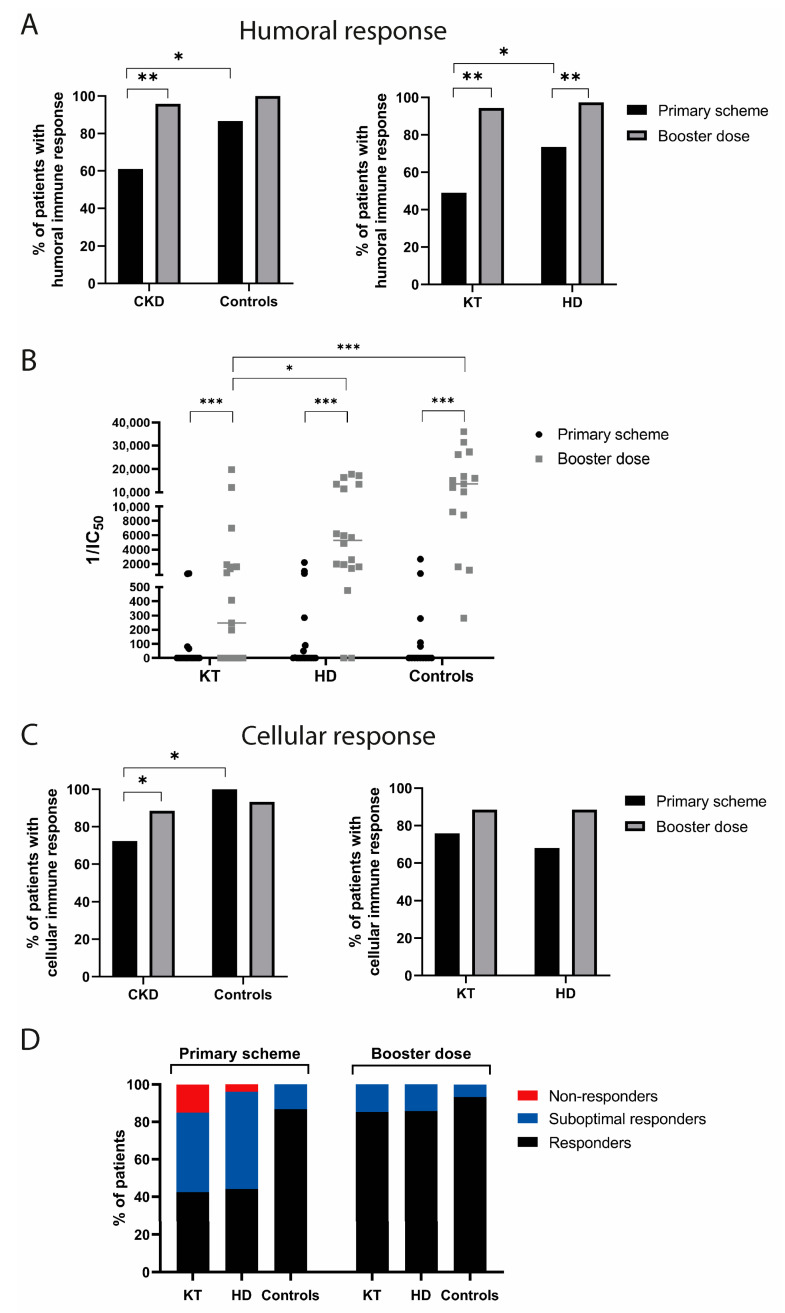
Figure 2.
Increase in immune responders after the third dose in CKD patients. (A) Percentage of humoral responders after the primary scheme and a booster dose according to IgG-Spike ELISA. Fisher’s exact test (* p < 0.05; ** p < 0.01). (B) Neutralizing antibodies 1/IC50 comparison between groups. Paired Wilcoxon signed-rank test (* p < 0.05; ** p < 0.01; *** p < 0.001). (C) Percentage of cellular responders for each group and time point. Positivity according to IFN-γ ELISpot and IFN-γ expressing CD4+ or CD8+ T cells measured by flow cytometry. Fisher’s exact test (* p < 0.05). (D) percentage of non-responders, suboptimal responders, and responders according to IgG-Spike ELISA and IFN-γ ELISpot and flow cytometry. Categories of non-responders define patients without humoral and cellular immune response, “suboptimal responders” signifies patients having only cellular or humoral responses, and “responders” signifies patients who had both immune responses. CKD: chronic kidney disease patients; HD: hemodialyzed patients; KT: kidney transplanted patients; Controls: healthy individuals; IC50: half maximal inhibitory concentration.

