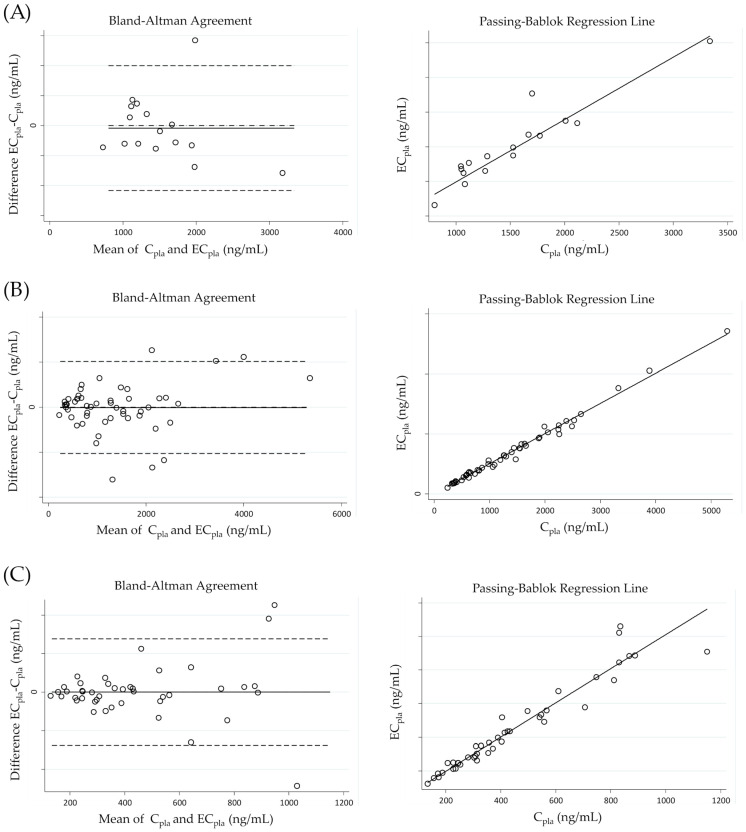
Figure 3.
Bland–Altman agreement and Passing–Bablok regression line for (A) rucaparib, (B) olaparib and (C) niraparib. In Bland–Altman plots biases are represented by marked lines, while dashed lines represent either lower and upper limits of agreements (defined as ±1.96 SD—standard deviation—of the bias) and an ideal bias of 0 ng/mL. In Passing–Bablok plots regression lines are represented by marked lines.

