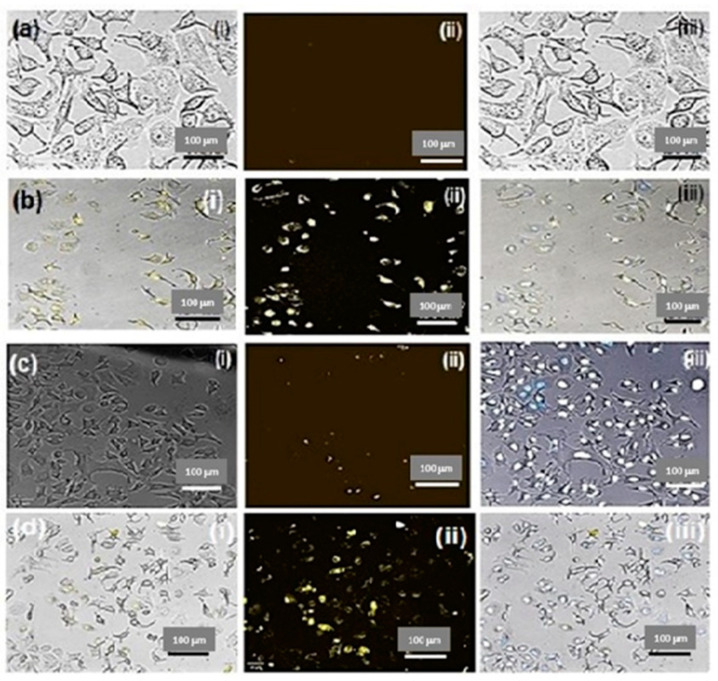
Figure 7.
Drug localization studies after 4 h of incubation of (a) control (untreated Caco-2 cells), (b) Caco-2 cells incubated with PF/HA–QtN#AgNPs, (c) control (untreated HeLa cells), and (d) HeLa cells incubated with PF/HA–QtN#AgNPs. The images are shown as (i) bright field, (ii) fluorescence, and (iii) merged images. The scale bars indicate 100 μm. The magnification is 10×.

