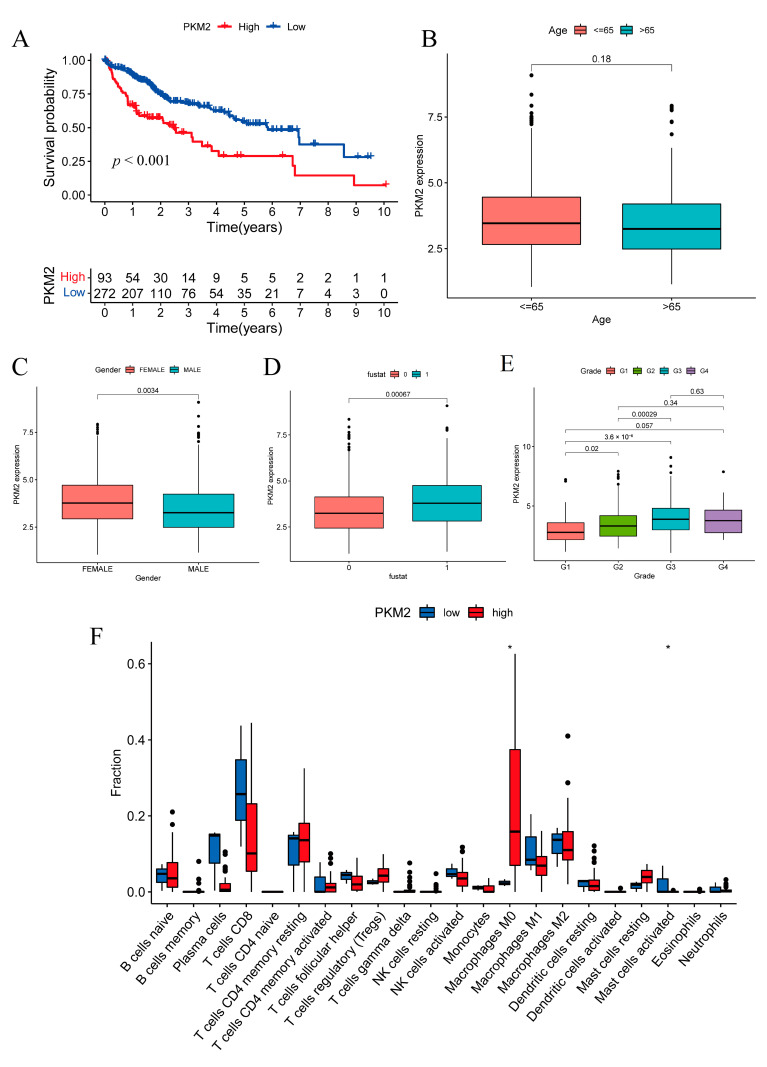
Figure 8.
Correlations between PKM2 expression, clinical characteristics and immune cell infiltration. (A) HCC OS was correlated with the PKM2 expression levels in the TCGA cohort. (B) Patient age showed no significant correlation with the PKM2 expression level. (C) Female patients tended to have higher PKM2 expression levels than male patients. (D) Patient survival state correlated with PKM2 expression level (fustat 0: alive, 1: dead). (E) Patient grades partially correlated with the PKM2 expression level (Grades 1, 2, 3) except for Grade 4. (F) Immune cell infiltration analysis indicated that there were differences in the M0 macrophages and activated mast cells between the PKM2 high and low subgroups (The bullets in the figure show the statistical outliers in the data). * p < 0.05.

