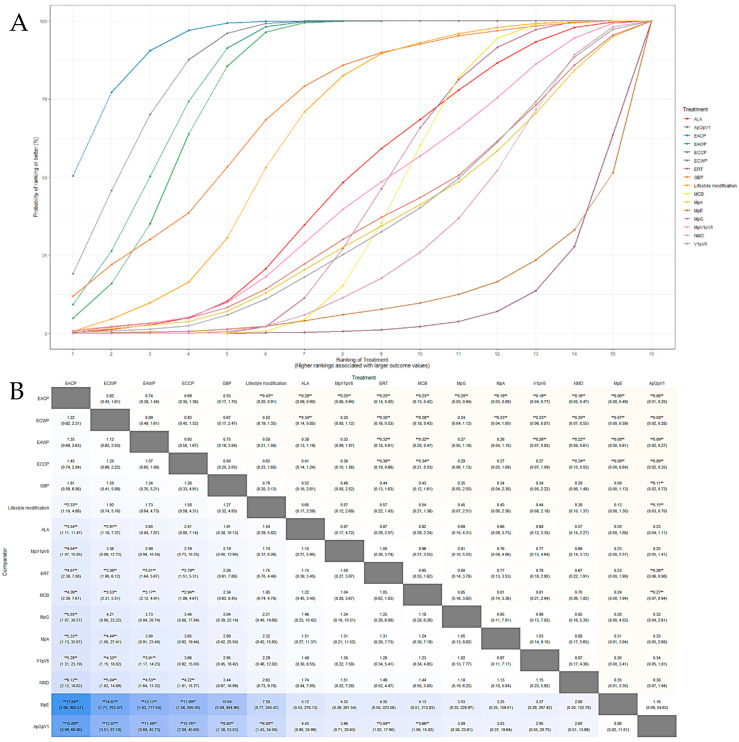
Figure 6.
(A) SUCRA plot for response rate; SUCRA: surface under the curve cumulative ranking probabilities, shows probability of ranking for each treatment illustrated by graphs. (B) League heat plot for response rate; OR is statistically significant when the 95% credible interval does not include 1 and are indicated by a double asterisk in league heat plot.

