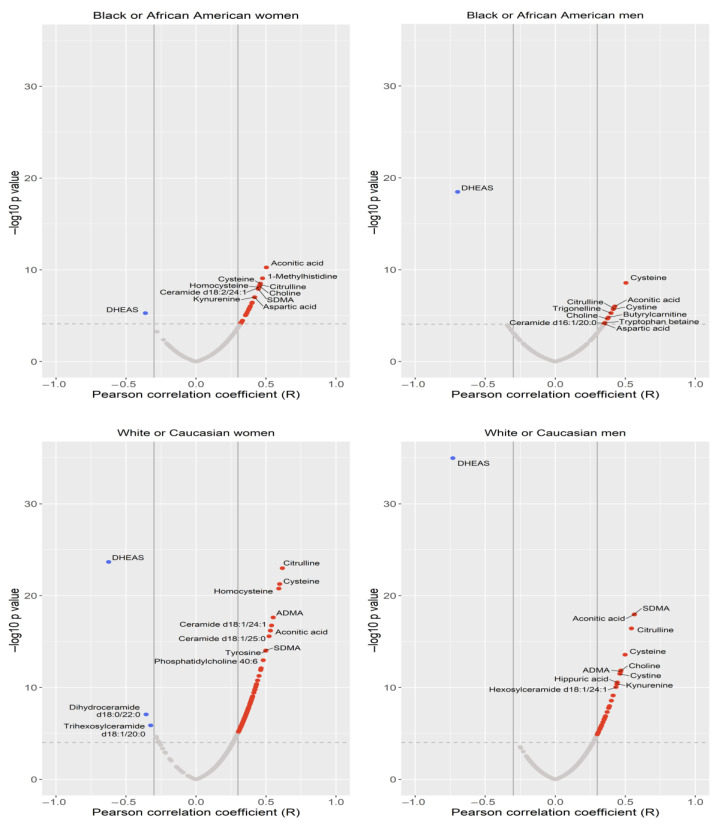
Figure 2.
Volcano plots of metabolites associated with age by sex and race. Legend: Red indicates metabolites that are positively associated with increasing age. Blue indicates metabolites that are negatively associated with increasing age. Dashed line indicates significance level at the q-value of 0.05.

