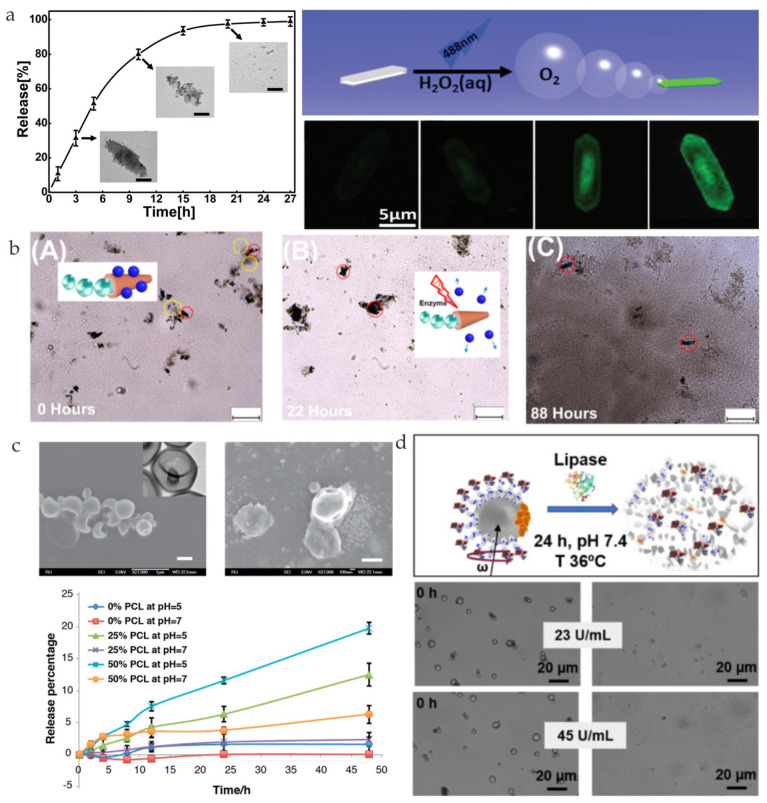
Figure 6.
(a) The degradation process of catalase and FITC−decorated PCL−SH single crystal (CAT−PCL−FITC) over time and its autonomous movement in H2O2 solution (reprinted with permission from Ref. [80]). (b) The degradation process of PCL−SH nanospheres and PCL−SH/Pt microrobots. The red circles indicate the microrobots and the yellow circles indicate the nanospheres (reprinted with permission from Ref. [81]). (c) The formation of pores in stomatocytes before and after degradation (reprinted with permission from Ref. [82]). (d) Scheme of the enzyme degradation of PCL−Fe3O4/PEI@DOX magnetic microrobots after 24 h of treatment with lipase (up) and microscopy images before and after 24 h of enzymatic treatment using lipase concentrations of 23 U/mL and 45 U/mL (down) (reprinted with permission from Ref. [83]).

