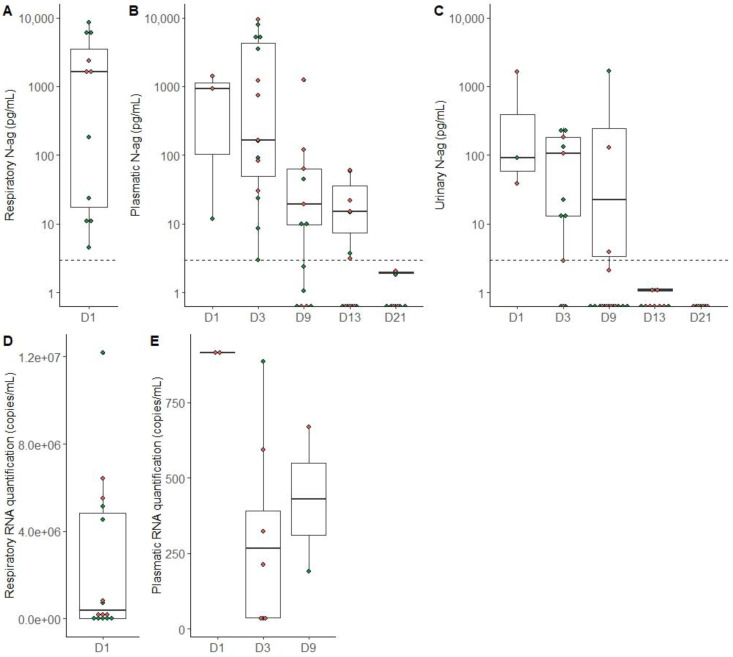
Figure 2.
SARS-CoV-2 antigen and RNA quantification in different sample types according to the time since inclusion. Green dots represent patients who survived and red dots represent patients who died during hospitalization, and dotted lines represent the positivity threshold of the ELISA assay. (A) Antigen quantification in respiratory samples on day 1. (B) Antigen quantification in plasma samples from day 1 to day 21. (C) Antigenic quantification in urine from day 1 to day 21. (D) RNA quantification in respiratory samples on day 1. (E) RNA quantification in plasma samples from day 1 to day 9.

