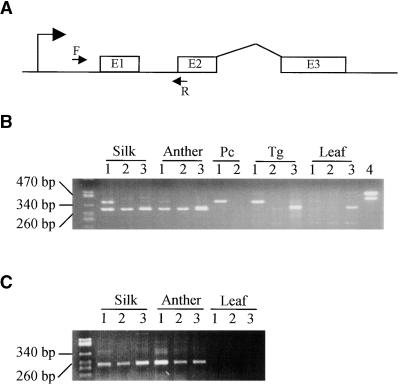
Figure 4.
RT-PCR Detection of p Gene Transcripts in Maize and Teosinte Floral Organs.
(A) Locations of primers in the p gene. The bent arrow at left indicates the transcription start site, and boxes E1, E2, and E3 indicate p gene open reading frame sequences (not to scale). The arrow F indicates forward primers EP5-8 (p1) or P2-5 (p2); the arrow R indicates the reverse primer EP3-13 (p1 and p2).
(B) RT-PCR analysis with primers EP5-8 and EP3-13, which amplify both p1 and p2 transcripts to generate products of 380 and 300 bp, respectively. Lanes 1, 2, and 3 use RNAs from maize P1-rr, maize P1-ww-1112, and teosinte parviglumis Iltis81-5, respectively. Lane 4 uses genomic DNA from P1-rr as a PCR control. RNA samples were prepared from the indicated organs. Neither p1 nor p2 transcripts were detected in the seedling leaf tissues tested here; however, more recent RT-PCR experiments have de-tected small amounts of p1 transcripts in leaf tissues (S.M. Cocciolone and T. Peterson, unpublished results). The band in the teosinte leaf RNA lane visible on the ethidium-stained gel appeared to be a nonspecific RT-PCR product, given its very weak hybridization to a p-specific probe (not shown). The numbers at left denote the sizes of DNA molecular weight standards. Pc, pericarp; Tg, tassel glume.
(C) RT-PCR analysis with primers P2-5 and EP3-13, which specifically amplify a 240-bp product derived from the p2 transcript. Lanes 1, 2, and 3 use RNAs prepared from the indicated organs of maize P1-rr, maize P1-ww-1112, and teosinte parviglumis Iltis81-5, respectively. The numbers at left denote the sizes of DNA molecular weight standards. The agarose gel containing RT-PCR products was blotted and hybridized with probe PMD, which detects the region amplified by PCR; the results (not shown) confirmed that the 240-bp band visible in the ethidium-stained gel is a p-specific PCR product.

