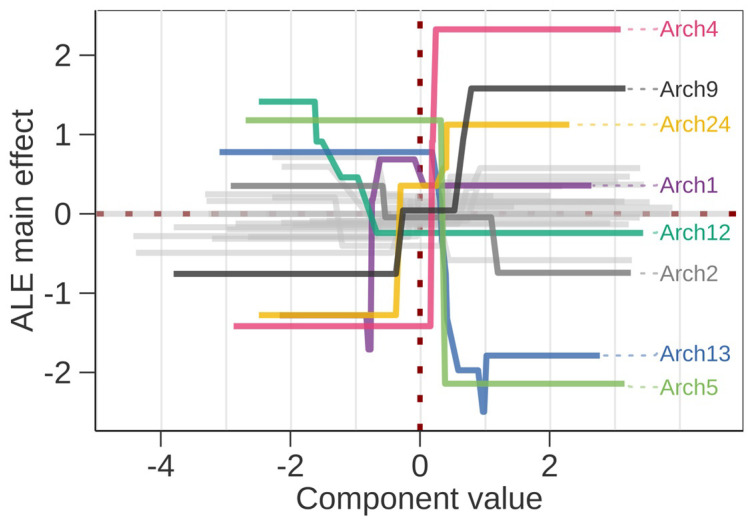
Figure 2.
Accumulated local effects plot for all predictors with component values on x-axis and impact on prediction on y-axis. Only the archetype components (Arch) where the difference between maximum and minimum local effect is >1.5 are highlighted by color and labeled. In addition, Arch2 that appears in the surrogate model is highlighted. On each axis the average value is zero and the component values are scaled to unit standard deviation.

