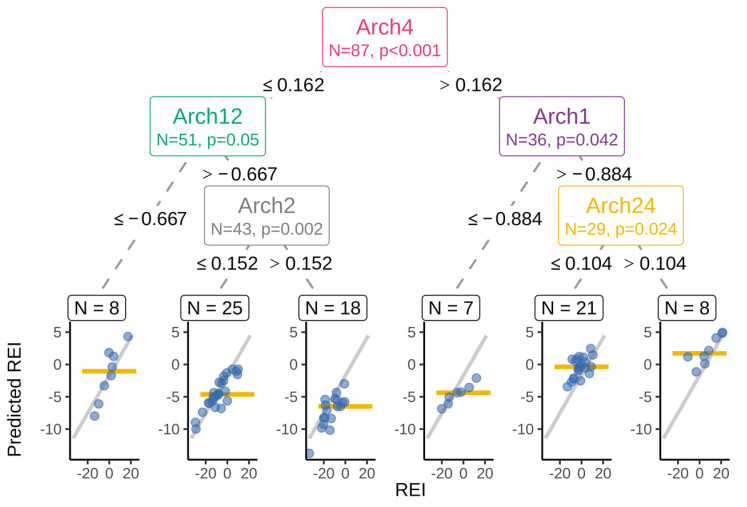
Figure 3.
Simplified surrogate model representing the main findings as an inference tree. Archetype component (Arch) name, number of cows, statistical significance test, the split thresholds given at nodes, and the child branches. Leave scatter plots show the original REI (on the x-axis) and the model predicted REI (y-axis) for each animal (blue circle) and the simplified tree prediction for the group as a horizontal line. Gray ascending line is the fitted overall regression line.

