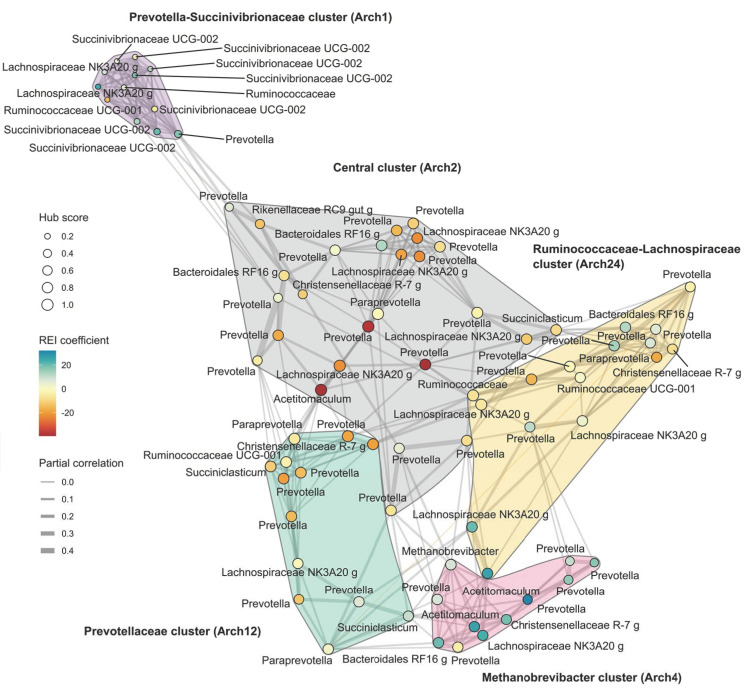
Figure 5.
Co-occurrence network based on the reconstructed abundance data. In the network the hub scores and the associations to REI are also indicated. The co-occurrence clusters are named based on their main hub taxa and their archetype component (Arch) association is indicated in parentheses. The single negative correlation is indicated as an orange edge linking the Paraprevotella to the Prevotella.

