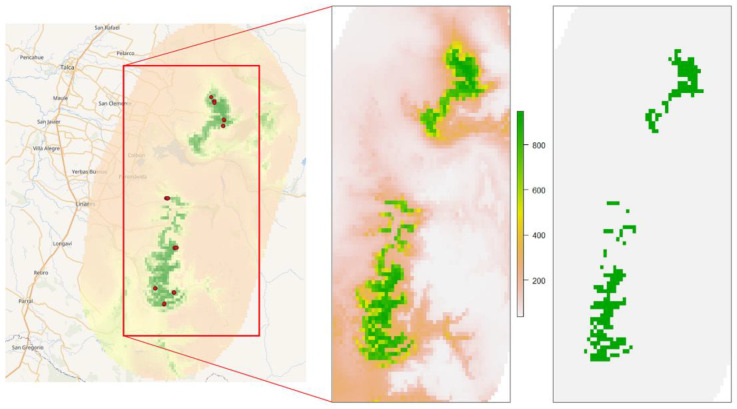
Figure 4.
Ensemble forecasting model for A. moorei (present scenario). The left image is the total ensemble model, with all known populations as red dots. The middle image shows the gradient in the habitat suitability index. The right image is the binary model considering the biomod2 threshold of minimum suitable habitat.

