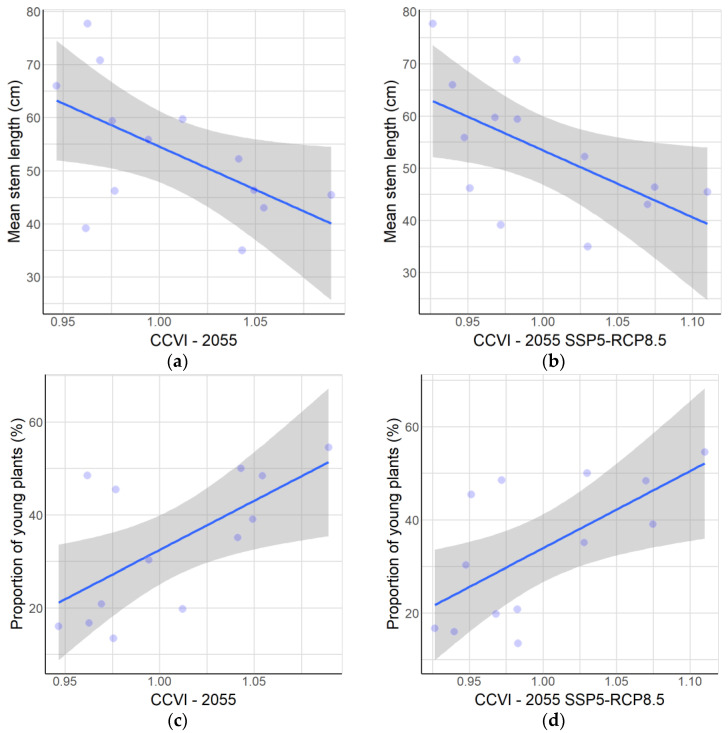
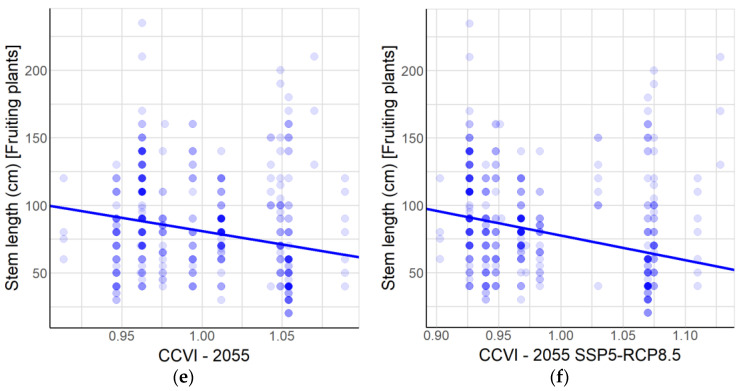
Figure 5.
Relationships between population parameters and vulnerability to climate change. At the population level: (a) Mean stem length compared to CCVI at year 2055 as average. (b) Mean stem length compared to CCVI for 2055 SSP5-RCP8.5 scenario. (c) Proportion of young plants compared to CCVI at year 2055 as average. (d) Proportion of young plants compared to CCVI for 2055 SSP5-RCP8.5 scenario. At the level of all individuals of A. moorei: (e) Stem length of fruiting plants compared to CCVI at year 2055 as average. (f) Stem length of fruiting plants compared to CCVI for 2055 SSP5-RCP8.5 scenario. The statistical parameters are given in Table 2.


