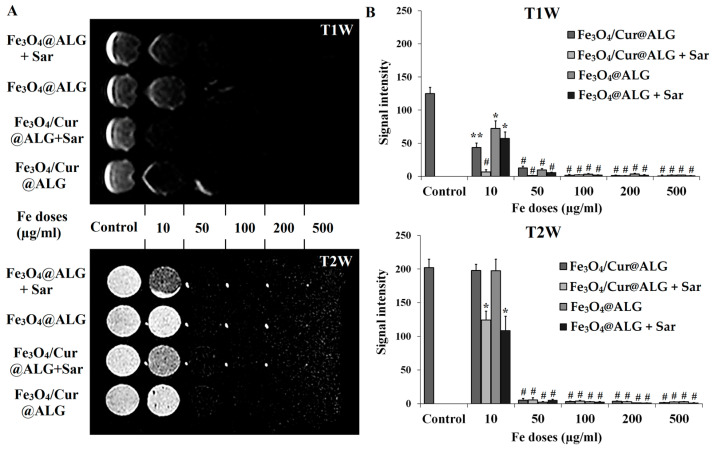
Figure 4.
MRI contrast enhancement of Fe3O4/Cur@ALG and Fe3O4@ALG NPs in vitro. (A) T1- and T2-weighted MR images (T1W and T2W, respectively) were obtained in the presence of the two types of NPs. Fe3O4/Cur@ALG and Fe3O4@ALG NPs at different concentrations of Fe from 10–500 µg/mL mixed with 1% agarose only and 1% agarose solution containing sarcoma 180 cells. (B) Quantitative analysis of MR signal intensity under different conditions. Data are presented as the mean ± SD of triplicate experiments. * p ˂ 0.05; ** p < 0.01; # p < 0.001. Sar: sarcoma cells.

