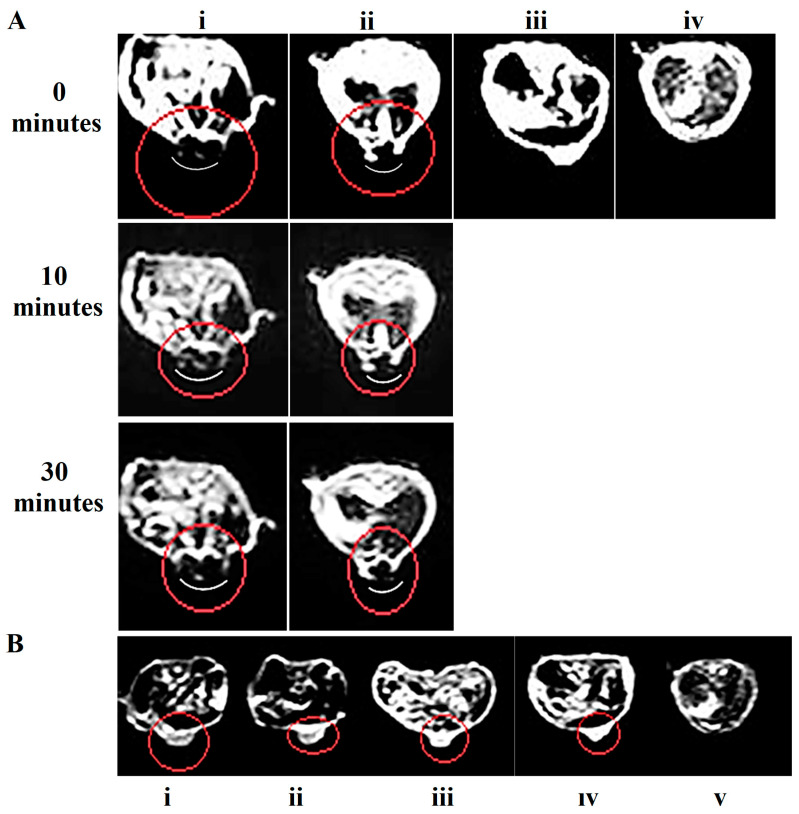
Figure 5.
MRI contrast enhancement of Fe3O4/Cur@ALG NPs in vivo. T2-weighted MR images were obtained with the parameters: TR/TE 3000/80 ms, 180-degree flip angle, and “head-to-tail” axis scanning. (A) Fe3O4@ALG NPs were directly injected into the tumor at two concentrations, 250 µg/0.5 cm3 (i) and 50 µg/0.5 cm3 (ii); the controls include a tumor control without nanoparticles (iii) and without tumors (iv). (B) Fe3O4/Cur@ALG NPs were injected via the tail vein of the mice at a concentration of 1000 µg/mouse. MR images were taken at 1 h (i), 6 h (ii), and 24 h (iii) post-injection. MR images of the tumor control without nanoparticles (iv) and the control without tumors (v). Red circles: the tumor region.

