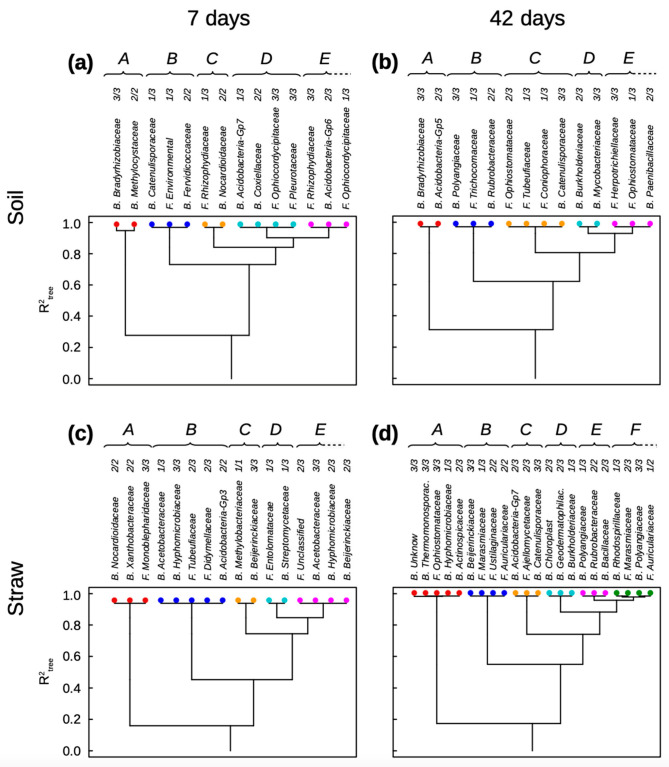
Figure 1.
Clustering analysis of basal soil respiration (a,b) and straw mineralization (c,d) after seven (a,c) and 42 days of incubation, explained by the relative abundance classes of bacterial and fungal families in soil. The functional groups and the classes of family relative abundance inside each functional group are sorted from left to right by their decreasing effects on the soil property. Each functional group has a color attributed: red for A, dark blue for B, yellow for C, light blue for D, pink for E, and green for F.

