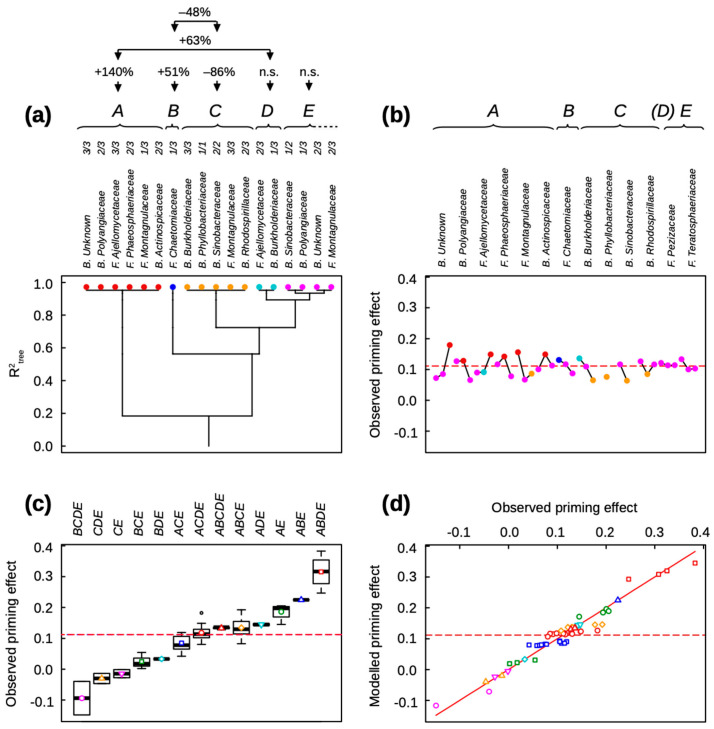
Figure 3.
Clustering analysis of the priming effect after 42 days of incubation, explained by the relative abundance classes of bacterial and fungal families in soil. (a) Clustering tree of classes of family relative abundance. The functional groups and the classes of family relative abundance inside each functional group are sorted from left to right by their decreasing effects on the priming effect. The above values indicate the significant effects (at p < 0.001) of the different functional groups and their interactions. (b) Mean observed priming effect of soils containing a given class of family relative abundance. The linked points correspond to the different classes of increasing relative abundance (from left to right) for each family. The used symbols are the same as those used in (a). (c) Boxplots of the observed priming effect sorted by assembly motifs, i.e., combinations of functional groups. The used symbols are the same as those used in (b). (d) Modeled versus observed priming effect. Different symbols correspond to different assembly motifs, i.e., combinations of functional groups. The red line is the bisector. (b–d) The dotted line is the mean observed priming effect.

