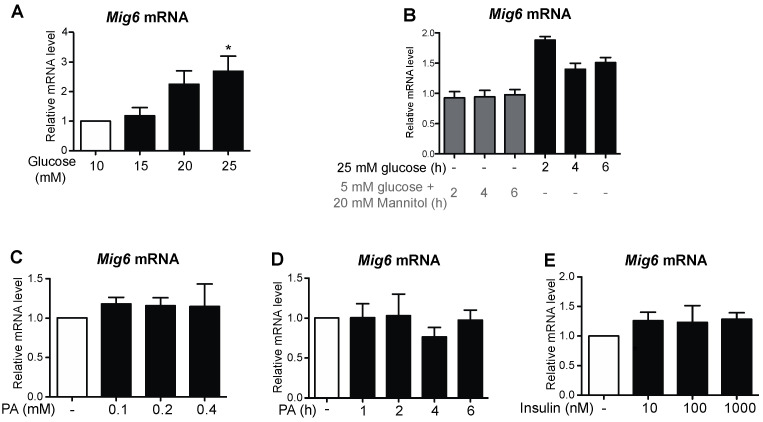
Figure 5.
Gluco-, but not lipotoxicity, alone induces Mig6 expression. 832/13 cells were treated with (A) 5, 10, 15, 20, or 25 mM glucose for 4 h, (B) 25 mM glucose or 5 mM glucose + 20 mM mannitol (as an osmotic stress control) for 0, 2, 4, or 6 h. (C) BSA, 100, 200, 400 μM palmitic acid complexed to BSA for 4 h. (D) A total of 400 μM palmitic acid for the indicated times, or (E) 0, 10, 100, or 1000 nM recombinant human insulin for 4 h. Mig6 mRNA levels were determined by qRT-PCR. Groups were compared using ANOVA. n ≥ 3 experiments. * p < 0.05 vs. BSA/5 mM glucose + 20 mM mannitol.

