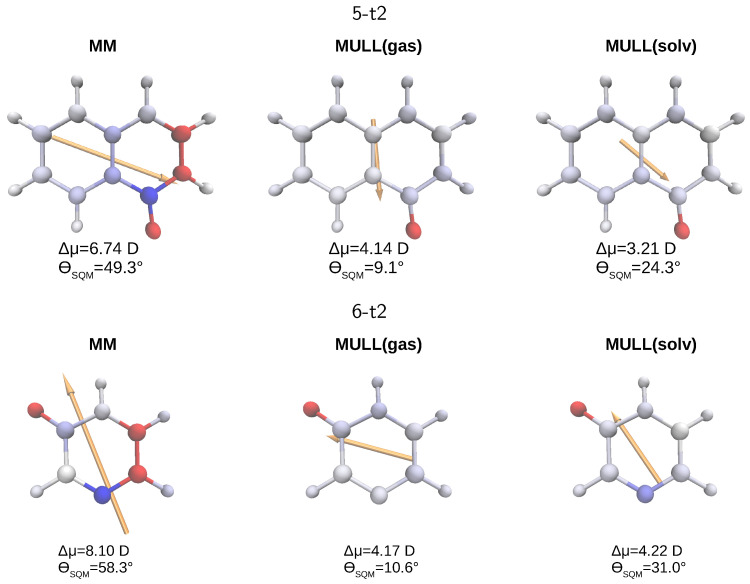
Figure 5.
Graphical representation of differences in partial atomic charges compared to MULL(solv*) for 5-t2 (top) and 6-t2 (bottom). Charge differences are indicated as a color gradient from blue () to red (). The differential dipole moment is displayed as an orange arrow. The magnitude and the angle between the dipole moment of the respective charge distribution with that of the MULL(solv*) reference distribution are given below each structure.

