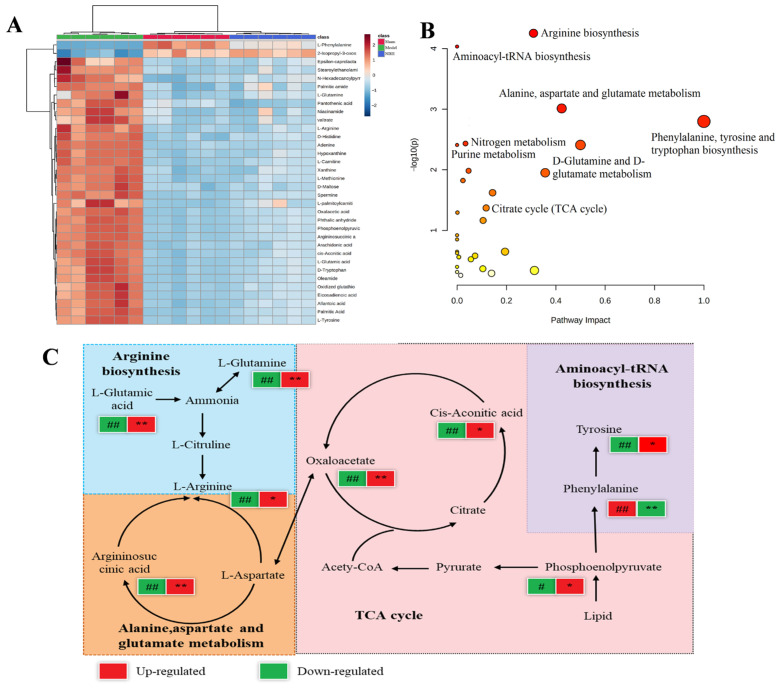
Figure 6.
Heat map (A) showing changes in intensities of potential biomarkers; bubble plot (B) showing the response of the main NBH-perturbed TDF-related pathway; metabolic pathways of TDF in NBH-treated TM3 cells (C), # p < 0.05. ## p < 0.01, the Model group versus the Sham group. * p < 0.05. ** p < 0.01, the NBH group versus the Model group.

