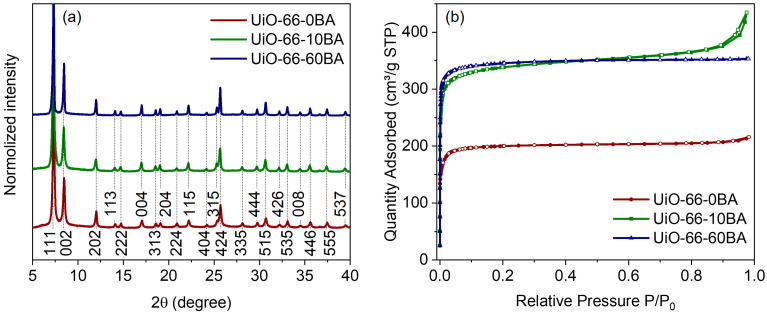
Figure 2.
(a) XRD patterns of the UiO-66 samples. Profiles were shifted along the intensity axis for better representation. Numbers designate Miller indices. (b) N2 sorption isotherms. Adsorption branches of isotherms are represented by lines with filled markers; desorption ones are shown by lines with empty markers.

