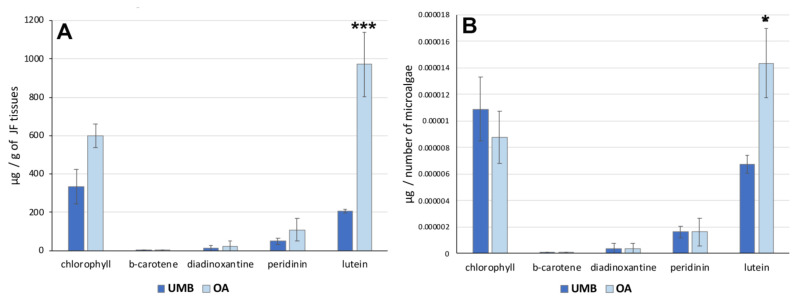
Figure 4.
(A) Graphs showing the concentration of pigments in the tissues of the umbrella (UMB) and oral arms (OA) of C. andromeda as expressed as mg per mg of lyophilized tissue (A) and per number of microalgae (B). Statistical analysis: two-way ANOVA test (p < 0.05) followed by Bonferroni test. Significant differences between UMB or OA are indicated with * for values of p < 0.05 and with *** for p < 0.001.

