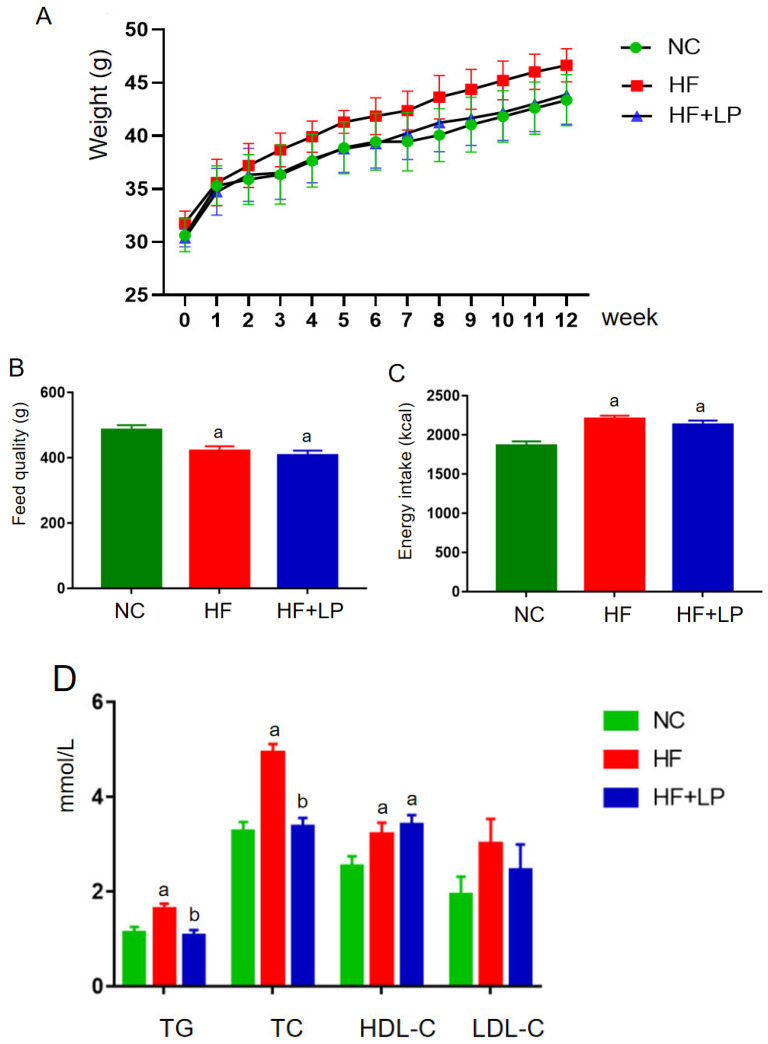
Figure 1.
The change in body weight and lipid-related indices in mice: (A) body weight; (B) feed quality; (C) energy intake (kcal); (D) plasma concentrations of lipid-related indices. Data are presented as means ± SD (n = 10). a: Compared with the NC group, p < 0.05; b: compared with the HF group, p < 0.05.

