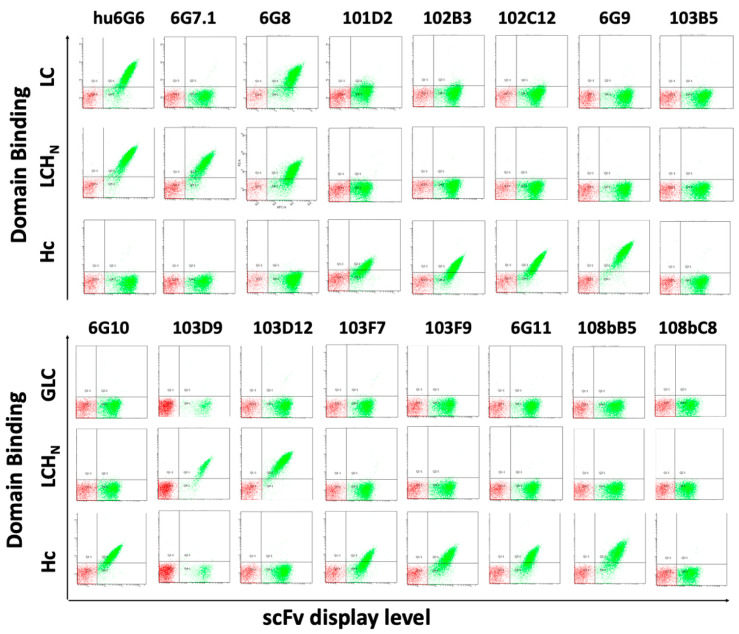
Figure 2.
The BoNT/G domain bound by scFvs. Yeast displayed scFvs were incubated with 100 nM BoNT/G LC, BoNT/G LC-HN or BoNT/G Hc-MBP, and binding was detected using anti-BoNT/Gi mouse serum and anti-mouse PE. ScFv display level on yeast was quantitated by co-staining with Alexa-647 conjugated anti-SV5 IgG (1:1000). The x-axis for each dot-plot indicates increasing scFv display level (mean fluorescence intensity), and the y-axis for each plot indicates increasing BoNT/G domain binding (mean fluorescence intensity). A humanized version of 6G6 (hu6G6) was used for this experiment.

