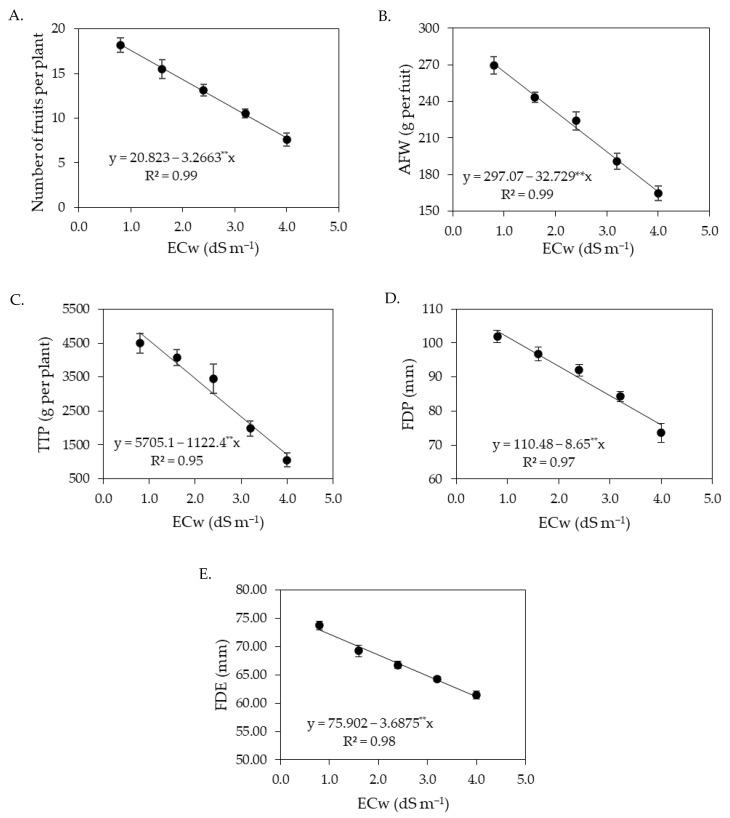
Figure 13.
Number of fruits per plant—NFP (A), average fruit weight—AFW (B), total production per plant—TPP (C), fruit polar diameter—FPD (D), and fruit equatorial diameter—FED (E) of sour passion fruit as a function of the levels ECw in the second production cycle. ** Significant at p ≤ 0.01. Vertical lines represent standard error of the mean (n = 3).

