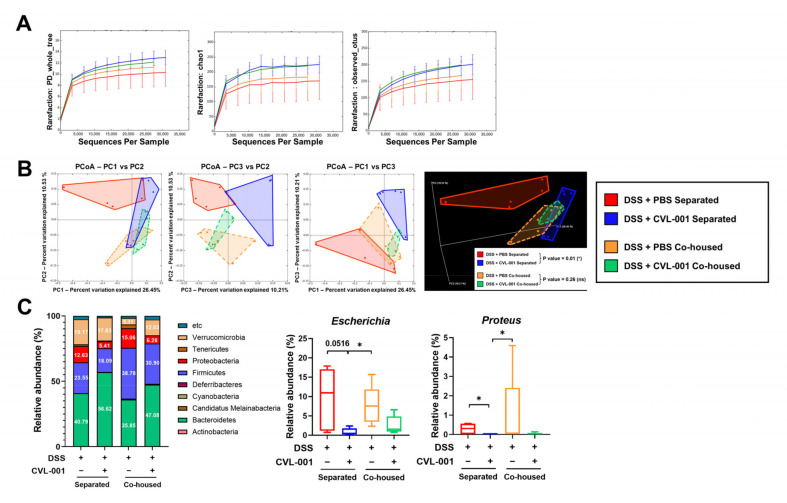
Figure 6.
Microbiota analysis of feces of mice with DSS-induced colitis. (A) Rarefaction curve of alpha diversity of the gut microbiota showing index for the PD_whole_tree and Chao1, observed OTUs (n = 5). (B) Principal component analysis (PCoA) illustrating beta diversity of each group using 2D and 3D plots (unweighted UniFrac distance, n = 5). (C) Abundance of microbiota composition at the phylum and genus level. The p values were determined using PERMANOVA on beta diversity, with the level of significance set at p < 0.05 (*). The significance of differences among the DSS-treated groups was assessed using the Mann–Whitney U test, with the level of significance set at p < 0.05 (*) for the microbiota composition analysis. OTU, operational taxonomic unit; PD, phylogenetic diversity; DSS, dextran sulfate sodium.

