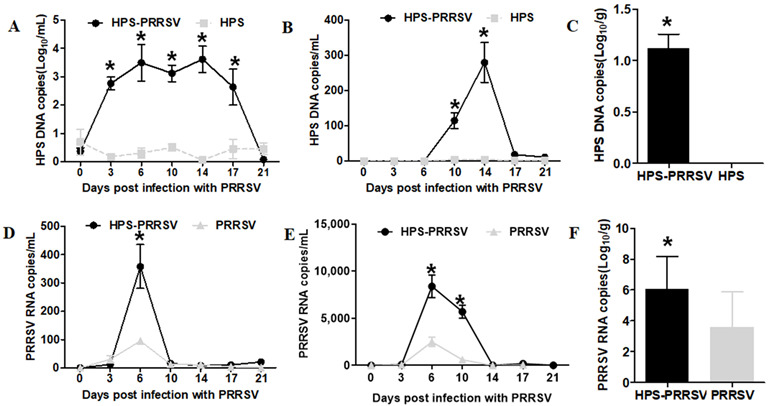
Figure 3.

Pathogen load in nasal, blood, and lung samples from infected pigs. Gps and HP-PRRSV2 genome copy numbers were measured by qRT-PCR at 0, 3, 6, 10, 14, 17, and 21 dpi. (A,D) Nasal swabs and (B,E) blood samples were collected to determine mRNA copy numbers by qRT-PCR at various time points. Data are presented as the mean ± SD; * compared to single-infected groups within the same day (p < 0.05, Student’s t-test). (C,F) At 6 days post-HP-PRRSV2 challenge, piglet lung tissues were collected in each group and analyzed by qRT-PCR. The data are expressed as the mean logarithm of Gps or HP-PRRSV2 genomic copy number per gram (n = 3 in each group). * Significant differences compared with Gps or HP-PRRSV2 alone groups (p <0.05, Student’s t-test).
