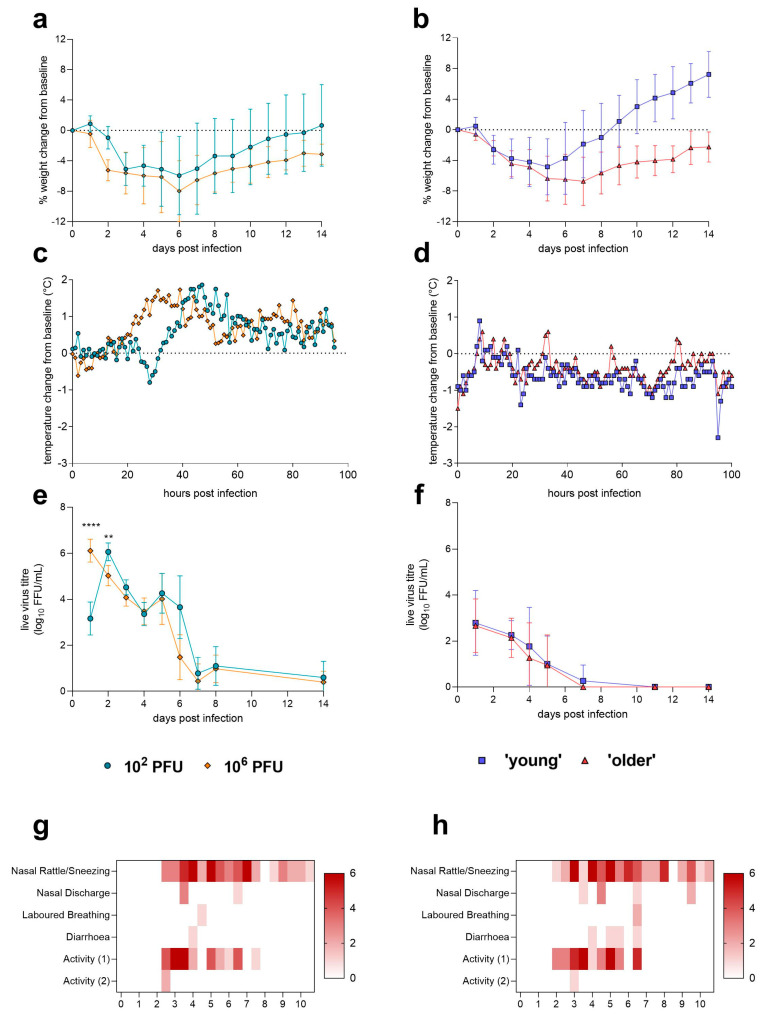
Figure 1.
Disease kinetics of H1N1 GM19 in ferrets and Golden Syrian hamsters (a) Ferrets and (b) hamsters were weighed daily, and percentage change of body weight from baseline was calculated. Lines show mean; error bars show SD. Both (c) ferrets and hamsters were implanted with data loggers that measured temperature every hour. Lines show mean. (d) Post-infection significantly lower temperatures were recorded in young hamsters compared to older hamsters (p = 0.0028). Lines show mean. (e) Nasal washes were taken from ferrets once daily until day 8 post-infection and at day 14 post-infection. Significantly (p < 0.0001) higher amounts of live virus were shed by the 106 PFU (high) dose-infected ferrets at day 1 post-infection. At day 2 post-infection, the 102 PFU (low) dose-infected ferrets were shedding significantly (p = 0.0071) more live virus. Statistical analysis was performed using a mixed-effects analysis on log10-transformed data. Lines show mean; error bars show SD. (f) Nasal washes were taken from hamsters every other day until day 7 post-infection and at days 11 and 14 post-infection. No significant differences were observed between young and older hamsters. Lines show mean; error bars show SD. Clinical signs of infection in ferrets were recorded twice daily in the (g) 102 PFU (low) dose and (h) 106 PFU (high) dose-infected groups. Activity (1): playful only when stimulated, Activity (2): not playful when stimulated. Hamsters were monitored twice daily but no clinical signs were observed following infection. ** p < 0.01, **** p < 0.0001.

