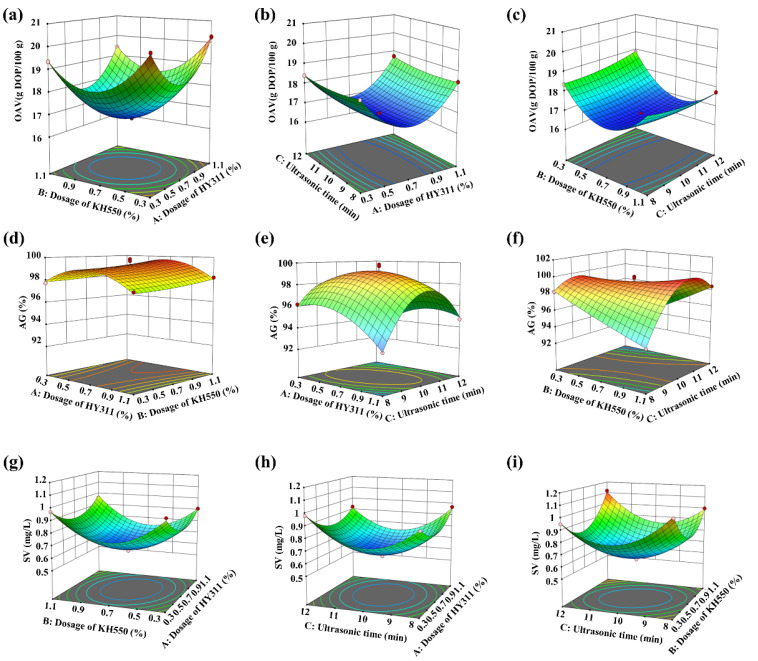
Figure 5.
Response surface plots of OAV (a–c), AG (d–f), and SV (g–i) based on the effect of A (HY311 dosage), B (KH550 dosage) and C (ultrasonic time). The varying color of the curved surface from blue to red indicates the increase of the values. The circles represent the values obtained in the tests, which are red if they are above the predicted value and pink if they are below the predicted value.

