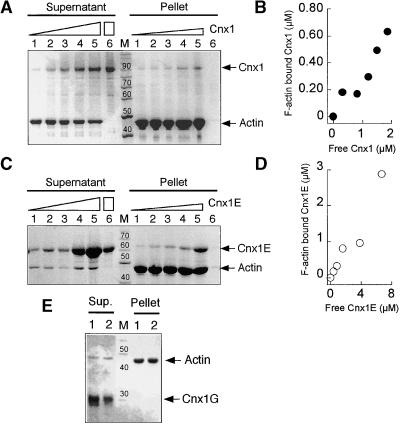
Figure 10.
Binding of Cnx1 to Actin Filaments.
(A) Cosedimentation of actin filaments with increasing amounts of Cnx1. SDS-PAGE analysis of pellet and supernatant fractions from 4.1 μM actin and 0.5, 1.0, 1.5, 2.0, and 2.5 μM Cnx1 (lanes 1 to 5, respectively) and 2.5 μM Cnx1 without actin (lane 6). The concentration of sedimented F-actin, determined densitometrically, was 2.3 μM. Triangles denote increasing amounts of Cnx1, whereas the rectangle denotes the greatest amount of Cnx1 used in the control.
(B) Cnx1 binding to F-actin. The protein concentrations of bound (pellet) and unbound (supernatant) Cnx1 were determined by densitometric scanning of the gel shown in (A).
(C) Cosedimentation of actin filaments with increasing amounts of Cnx1 E domain. SDS-PAGE analysis of pellet and supernatant fractions of cosedimentation experiments with 4.2 μM actin and 0.6, 1.2, 2.4, 4.8, and 9.6 μM Cnx1 E domain (lanes 1 to 5, respectively) and 2.4 μM Cnx1 without actin (lane 6). The concentration of sedimented F-actin was determined by densitometry as 3.6 μM. Triangles denote increasing amounts of Cnx1E, whereas the rectangle denotes the greatest amount of Cnx1E used in the control.
(D) Binding of Cnx1 E domain to F-actin. The protein concentrations of bound (pellet) and unbound (supernatant) E domain were determined by densitometric scanning of the gel shown in (C).
(E) Cosedimentation of actin filaments with the Cnx1 G domain. SDS-PAGE analysis of pellet and supernatant fractions of cosedimentation experiments with 4 μM actin and 1 and 2 μM G domain (lanes 1 and 2, respectively).
The length markers in (A), (C), and (E) = 10 kD; the numbers above the bands indicate the molecular weight of the marker bands; M, protein standard for molecular weight.

