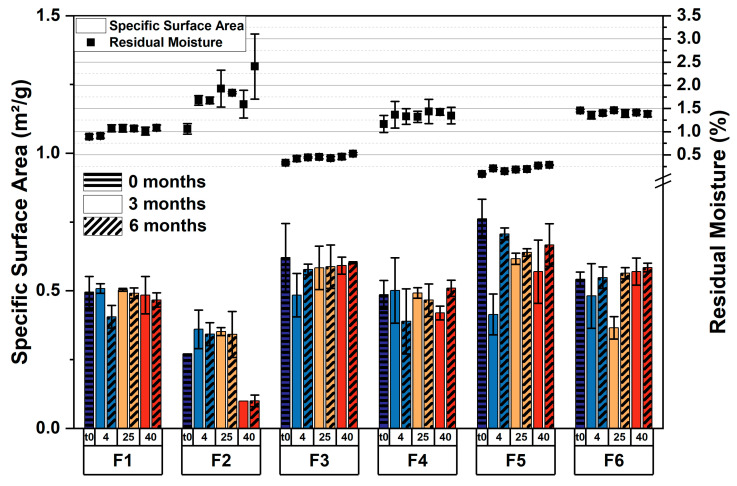
Figure 3.
Solid-state properties of lyophilized formulations. Specific surface area (bars) and the respective residual moisture data (symbols) were obtained directly after lyophilization and during the stability study over the course of 6 months. The values are means (n = 2 for SSA; n = 3 for rM) ± standard deviation. Storage temperatures: 4, 25, and 40 °C.

