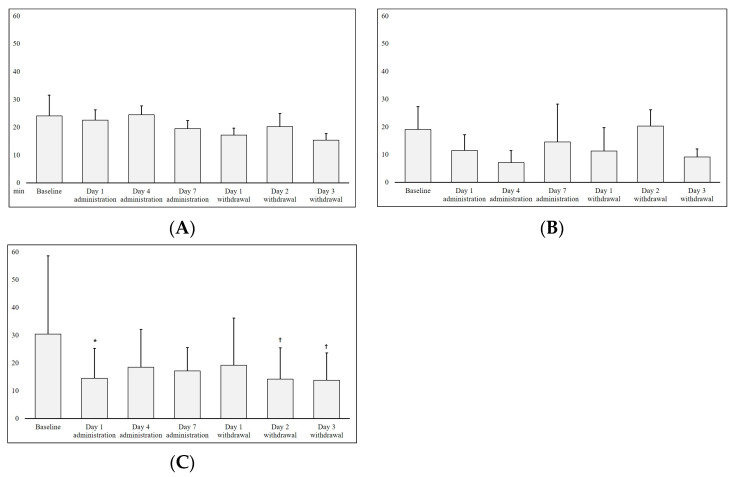
Figure 3.
Cumulative latency time from the sleep–wake profile of rats administered with the human-gut-derived live Prevotella bacteria. p values (symbols * and † indicate <0.05 and <0.01, respectively) were derived from the Wilcoxon signed rank test in comparison to the baseline. (A) No administration group; (B) P. stercorea group; (C) P. histicola group.

