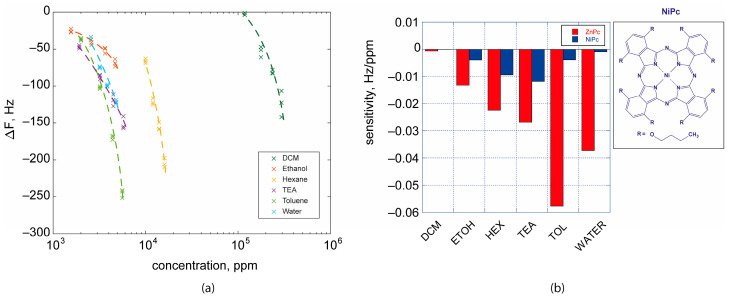
Figure 4.
(a) Characteristic curves of QMB sensor based on 4. Data are reported on a semilogarithmic scale due to the wide range of VOC concentrations. (b) Sensitivities calculated as the first derivative of linear fitting equations of data in the range of concentration measured. In the case of NiPc data, and experimental details were previously reported in [25].

